Bettiah Population: Bettiah is a Nagar Parishad city situated in the Bettiah block of Pashchim Champaran district.
The Bettiah city is divided into 39 wards for which elections are held every 5 years.
As per the Population Census 2011, there is a total of 24,463 families residing in the Bettiah city.
The total population of Bettiah is 132,209 out of which 69,529 are males and 62,680 are females thus the Average Sex Ratio of Bettiah is 901.
The Bettiah Population of Children age 0-6 years in Bettiah city is 18995 which is 14% of the total population.
There are 10039 male children and 8956 female children between the age of 0-6 years.
As per the Census 2011, the literacy rate of Bettiah is 80.6%. Thus Bettiah has a higher literacy rate compared to 55.7% of the West Champaran district.
The male literacy rate is 85.02% and the female literacy rate is 75.8% in Bettiah.
| State Name | District Name | SubDistrict | PinCode | Name | Level |
|---|---|---|---|---|---|
| Bihar | Pashchim Champaran | Bettiah | 845438 | Bettiah (Nagar Parishad) | TOWN |
| Total Bettiah Population | Literacy Rate | Sex Ratio |
|---|---|---|
| 132,209 | 80.6% | 901 |
Bettiah Nagar Parishad has total administration over 24,463 houses to which it supplies basic amenities such as water and sewerage.
It is also authorized to build roads within Nagar Parishad limits and impose taxes on properties coming under its jurisdiction.
Read Also: All About Bettiah Nagar Parishad
The details of the 2011 census by population are as follows.
- Paschimi Champaran is 9th in the state of Bihar in terms of population (39,35,042) and area (5,228 sq km).
- In terms of population per sq km. Paschim Champaran is the 35th densely populated district in the state with 753 persons per square kilometer as against 1,106 in the state.
- Paschimi Champaran ranks 24th in terms of sex-ratio (909) against the state’s 918.
- Paschim Champaran ranks 8th in terms of child sex-ratio (953) as against 935 in the state.
- There are 118 uninhabited villages (out of a total of 1,483 villages) in West Champaran district.
- Literacy Rate: 55.70%
Annual Bettiah Population Change
| 2001-2011 | 1991-2001 |
|---|---|
| +2.92 %/year | +2.33 %/year |
Demographics Of Bettiah City
The city is home to about 1.3 lakh people, among them about 70 thousand (53%) are male and about 63 thousand (47%) are female.
93% of the whole population are from general caste, 6% are from schedule caste and 1% are scheduled tribes.
The child (aged under 6 years) population of Bettiah Nagar Parishad is 14%, among them, 53% are boys and 47% are girls.
There are about 24 thousand households in the city and an average of 5 persons live in every family.
![Bettiah Nagar Parishad [845438] - Pashchimi Champaran, Bihar 3 Demographics Of Bettiah City](https://apnabettiah.in/wp-content/uploads/2020/09/Demographics-Of-Bettiah-City.jpg)
Caste wise Bettiah male female Bettiah Population 2011
| # | Total | General | Schedule Caste | Schedule Tribe | Child |
|---|---|---|---|---|---|
| Total | 132,209 | 123,115 | 8,266 | 828 | 18,995 |
| Male | 69,529 | 64,777 | 4,315 | 437 | 10,039 |
| Female | 62,680 | 58,338 | 3,951 | 391 | 8,956 |
Religion wise distribution of Bettiah population
Hindus contribute 64% of the total population and are the second largest religious community in the city followed by Muslims which contribute 34% of the total Bettiah Population and Christians are the third largest religious community here with 2% population.
The female Sex ratio per 1000 male in Hindus is 886 in Muslims are 923 and in Christians are 1058.
![Bettiah Nagar Parishad [845438] - Pashchimi Champaran, Bihar 4 Bettiah Nagar Parishad [845438] - Pashchimi Champaran, Bihar 1](https://apnabettiah.in/wp-content/uploads/2020/09/Religion-wise-distribution-of-Bettiah-population.jpg)
Religion wise population Bettiah
| # | Total | Hindu | Muslim | Christian | Sikh | Buddhist | Jain | Others | Not Stated |
|---|---|---|---|---|---|---|---|---|---|
| Total | 132,209 | 84,725 | 44,579 | 2,513 | 150 | 13 | 13 | 37 | 179 |
| Male | 69,529 | 44,931 | 23,176 | 1,221 | 71 | 6 | 7 | 19 | 98 |
| Female | 62,680 | 39,794 | 21,403 | 1,292 | 79 | 7 | 6 | 18 | 81 |
Growth of population
The population of the city has increased by 13.3% in the last 10 years. In the 2001 census total population here was about 1.2 lakh.
The female population growth rate of the city is 14.1% which is 1.5% higher than the male population growth rate of 12.6%.
The general caste population has increased by 13.5%; the Schedule caste population has increased by 8.6%;
Schedule Tribe population has increased by 46.5% and the child population has decreased by -3.2% in the city since the last census.

Growth of population (percent) 2001 to 2011 – Bettiah
| # | Total | General | Schedule Caste | Schedule Tribe | Child |
|---|---|---|---|---|---|
| Total | 13.3% | 13.5% | 8.6% | 46.5% | -3.2% |
| Male | 12.6% | 12.9% | 5.3% | 63.7% | -1.4% |
| Female | 14.1% | 14.1% | 12.5% | 31.2% | -5.2% |
[Sex Ratio] Females per 1000 Male
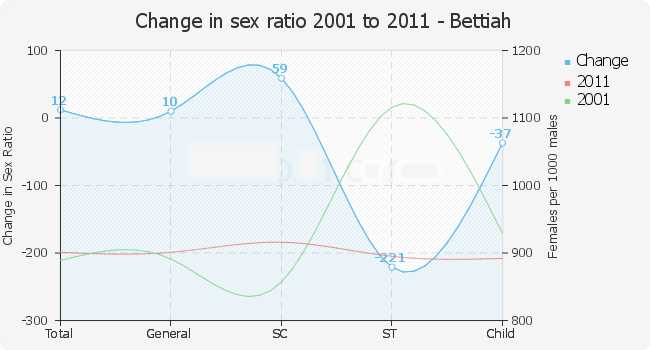
As of the 2011 census, there are 901 females per 1000 males in the city. The sex ratio in the general caste is 901, in schedule caste is 916 and in the schedule, the tribe is 895.
There are 901 girls under 6 years of age per 1000 boys of the same age in the city.
The overall sex ratio in the city has increased by 12 females per 1000 males during the years from 2001 to 2011.
The child sex ratio here has decreased by 37 girls per 1000 boys at the same time.

Change in sex ratio 2001 to 2011 – Bettiah
| # | Total | General | SC | ST | Child |
|---|---|---|---|---|---|
| Change | 12 | 10 | 59 | – 221 | – 37 |
| 2011 | 901 | 901 | 916 | 895 | 892 |
| 2001 | 889 | 891 | 857 | 1116 | 929 |
Literacy Rate In Bettiah
Total of about 91 thousand people in the city are literate, among them about 51 thousand are male and about 41 thousand are female.
The literacy rate (children under 6 are excluded) of Bettiah is 81%. 85% of males and 76% of the female Bettiah Population are literate here.
Overall literacy rate in the city has increased by 5%. Male literacy has gone up by 3% and the female literacy rate has gone up by 8%.

Change in literacy rate 2001 to 2011 – Bettiah
| # | Total | Male | Female |
|---|---|---|---|
| Change | 4.7% | 2.5% | 7.4% |
| 2011 | 80.6% | 85% | 75.8% |
| 2001 | 75.9% | 82.5% | 68.4% |
Workers profile
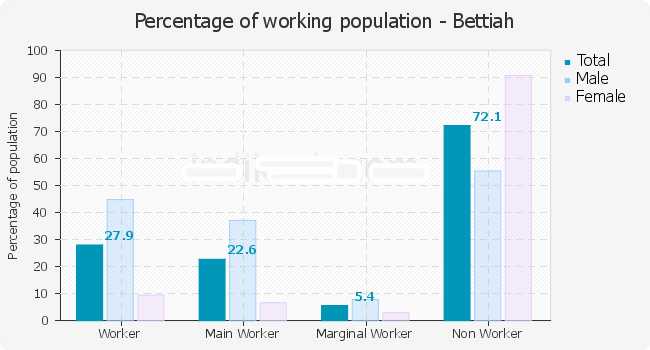
Bettiah has 28% (about 37 thousand) population engaged in either main or marginal works. 45% male and 9% female population are working population.
37% of the total male population are main (full time) workers and 8% are marginal (part-time) workers.
For women, 7% of total female population is the main, and 3% are marginal workers.

Percentage of working population – Bettiah
| # | Worker | Main Worker | Marginal Worker | Non Worker |
|---|---|---|---|---|
| Total | 27.9% | 22.6% | 5.4% | 72.1% |
| Male | 44.7% | 37% | 7.7% | 55.3% |
| Female | 9.3% | 6.5% | 2.8% | 90.7% |
Bettiah Religion Data 2011
| TOWN | POPULATION | HINDU | MUSLIM | CHRISTIAN | SIKH | BUDDHIST | JAIN | OTHERS | NOT STATED |
|---|---|---|---|---|---|---|---|---|---|
| Bettiah | 132,209 | 64.08% | 33.72% | 1.90% | 0.11% | 0.01% | 0.01% | 0.03% | 0.14% |
Caste wise Population Of Bettiah City
Schedule Caste (SC) constitutes 6.3% while Schedule Tribe (ST) were 0.6% of total population in Bettiah.
| # | Total | Male | Female |
|---|---|---|---|
| Schedule Caste | 8,266 | 4,315 | 3,951 |
| Schedule Tribe | 828 | 437 | 391 |
FAQ: Bettiah Population
Que – What is the population of Bettiah in 2020?
Ans – the last known bettiah city population is around 132 500 (the year 2011). This was 0.012% of the total Indian population.
If the population growth rate would be the same as in the period 2001-2011 (+2.92%/year), the Bettiah population in 2020 would be around 201 428.
Que – Bettiah Literacy Rate 2011
Ans – The literacy rate of Bettiah Agglomeration is 79.04% which is lower than the National Urban average of 85 %. The literacy rate for males and females for Bettiah stood at 83.67 % and 73.89 % respectively.
Total literates in Bettiah UA were 104,645 of which males were 58,298 and the remaining 46,347 were females.
Que – Bettiah Sex Ratio 2011
Ans – The sex ratio of female to male in Bettiah UA was found lower with a figure of 901 females against the national urban average of 926 females per 1000 males.
For children (0-6 age), girls were 905 per 1000 boys in the Bettiah Urban region against the national average of 902 girls per 1000 boys.
Que – Bettiah Child Population 2011
Ans – The children (0-6 age) population of Bettiah UA is around 14.87 % of the total Bettiah UA population which is higher than the National Urban average of 10.93 %.
Total children in the Bettiah Urban region were 23,119 of which males were 12,135 while the remaining 10,984 children were female.

